
Greater Toronto Area Real Estate Market
Greater Toronto Area Real Estate Market
Historical & Monthly Analysis for August 2025
This report offers a comprehensive look at the Toronto Regional Real Estate Board’s (TRREB) market data, starting with an at-a-glance summary of last month’s activity before drilling down into deeper historical trends.
August 2025 Market-at-a-Glance
Average Price
$1,022,143
vs July 2025
vs Aug 2024
Sales Volume
5,211
vs July 2025
vs Aug 2024
Market Pulse: Cooling trend accelerates with significant declines from both last month and last year, shifting leverage to buyers.
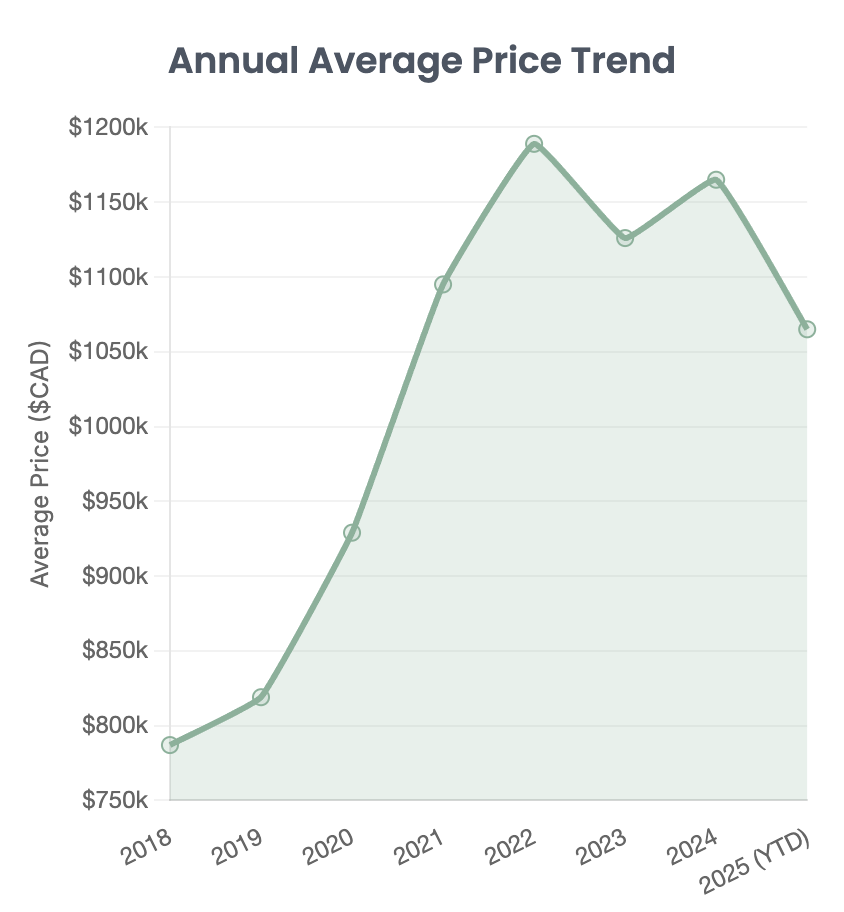
Long-Term Market Journey: 2018-2025
An eight-year look at annual sales volume and average selling price in the GTA.
Annual Average Price Trend
Annual Sales Volume Trend
Key Market Events Timeline
2018-2019
Market Stabilization & Recovery
2020-2021
Pandemic-Driven Sales & Price Boom
2022-2023
Interest Rate Hikes & Market Correction
2024-2025
Price Rebound Followed by Cooling Period
Year-Over-Year Snapshot: August 2023 – 2025
2-Year Price Change
2-Year Sales Change
August Sales Comparison (2023-2025)
August Average Price Comparison (2023-2025)
Recent & Historical Trends
24-Month Average Price Trend
Average Price (August 2025)
$1,022,143
24-Month Trend Insight
The average selling price has seen significant fluctuation over the past two years. After a period of growth culminating in a peak during the spring of 2024, the market has entered a cooling phase. The current price represents a notable decline from that peak and is now below the level seen two years ago in August 2023, highlighting the extent of the recent market correction.
4-Month Sales Activity Trend
Sales Volume (August 2025)
5,211
Monthly Trend Insight
Sales volume has seen a consistent decline over the summer months, with August marking the lowest point in this period. This slowdown suggests a decrease in buyer activity, which could be attributed to seasonal holiday effects or a broader market reaction to economic conditions.
Market Commentary & Outlook
The long-term data, stretching back to 2018, shows the cyclical nature of the GTA housing market. After the major boom of 2020-2021 and the subsequent correction in 2022-2023, the market is once again in a cooling phase in 2025. Sales volume is down over 30% compared to August 2023, and the 24-month price trend clearly shows that the market is now trading below the levels of two years prior.
The recent monthly trend, with its steady decline in both sales and prices, reinforces this narrative. The market is clearly shifting towards a more balanced state, heavily influenced by affordability challenges and higher borrowing costs that temper buyer demand. The intense competition of previous years has subsided, granting more negotiating power to prospective buyers.
Outlook: The fall market will be a critical test. A typical seasonal rebound in activity is expected, but its strength will determine the market’s direction for the remainder of the year. If inventory continues to outpace sales, further price stabilization or modest declines are likely. The long-term demand fundamentals in the GTA remain strong, but short-term dynamics are now firmly in a buyer-friendlier phase.